R syntax comparison

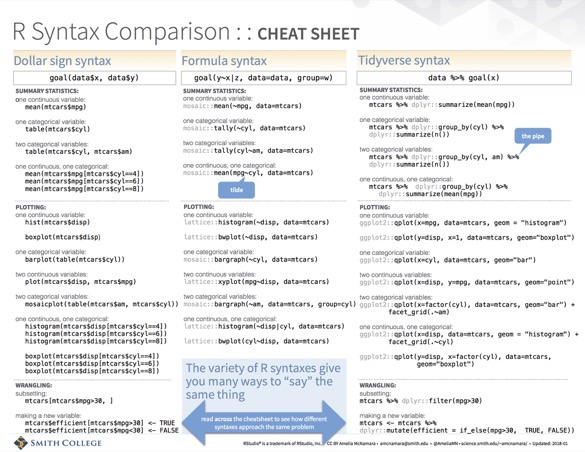
For my rstudio::conf working, Intro to R & RStudio, I finally finished my cheatsheet on R syntaxes. I’ve been working on this for at least a year (😱 ), so I’m glad to see it out in the wild.
When I posted the cheatsheet online, I got some critical feedback, which I would like to address in the form of a FAQ.
Q: Why didn’t you include data.table syntax?
A: Mostly, because I don’t know data.table, so I wouldn’t have done a good job. Also, because I don’t know of anyone who is teaching data.table to absolute novices. However, if someone wanted to generate all the analogous tasks (summary statistics, plots, wrangling) in data.table and share them, I would be very interested.
Q: Why did you use the word “syntax” when that’s not quite precise?
A: Because that is a word commonly associated with programming languages. While these three paradigms may not be precisely three different syntaxes, they are certainly syntactic sugar or idioms within the language. I often refer to them as like accents within a human language. If you were learning English, you wouldn’t try to learn it with a British accent, an accent from the American South, and an accent from Australia. You’d learn it one way, and be able to recognize other accents.
Q: Why didn’t you express [x] in this more efficient way?
A: This usually comes up because of my use of
mean(mtcars$mpg[mtcars$cyl==4])
mean(mtcars$mpg[mtcars$cyl==6])
mean(mtcars$mpg[mtcars$cyl==8])
instead of
tapply(mtcars$mpg, mtcars$cyl, mean)and
mtcars <- mtcars %>%
    mutate(efficient = if_else(mpg>30,  TRUE, FALSE))
instead of
mtcars <- mtcars %>%
    mutate(efficient = if_else(mpg>30))
In both of these cases, I was erring on the side of
- more verbosity
- a more general pattern
Personally, although I learned R long before the tidyverse existed, I never got adept at the apply() family of functions. Every time I needed to use one, it was a fall down a rabbithole of “tapply? sapply? mapply?” (In fact, trying to create that tapply call for this post included just such a search.) While I would encourage people coding within the base R paradigm to learn these functions, I think the three-line version is easier to think through, and represents a much more common “style” that you will see on places like StackOverflow. In many cases, there is no apply equivalent, and you end up doing this sort of repetitive writing of the dataset name and nesting of statements.
With the mutate() call, even though it was unnecessary to include the TRUE and FALSE, I knew that it would provide a better pattern for students who wanted to make their own variables. If you want efficient to instead be “yes” and “no” character strings, you can just sub “yes” for TRUE and “no” for FALSE, without having to think about the magic that goes with logicals.
Q: Why didn’t you show ggformula or the formula-based base R plots?
A: I did! They’re just on the back of the sheet. I don’t feel like ggformula is a full-fledged graphics library yet, so I don’t want to present it as such. base graphics, lattice graphics and ggplot2 graphics are all full libraries, so I used those on the front of the sheet. As for formula-based base R plots, I think they are much less common online. My main use case for this cheatsheet is to give to students who I am teaching one particular syntax. For example, I used to teach completely in the formula syntax, but have switched to tidyverse syntax. However, sometimes when I demo code I switch to another syntax because it feels more natural for the task. Or, students google something and find code from another syntax. The cheatsheet serves as a grounding device to say, this is just another way to express the same idea I am familiar with. Since I (almost) never teach base R, I include it on the cheatsheet mostly as a foil to my argument that the tidyverse is more human-readable.
Do you have other questions? Ask me in the comments!